


Transaction Center
Time to bring it home. Find zipForm®, transaction tools, and all the closing resources you'll need. Except for the champagne — that's on you.
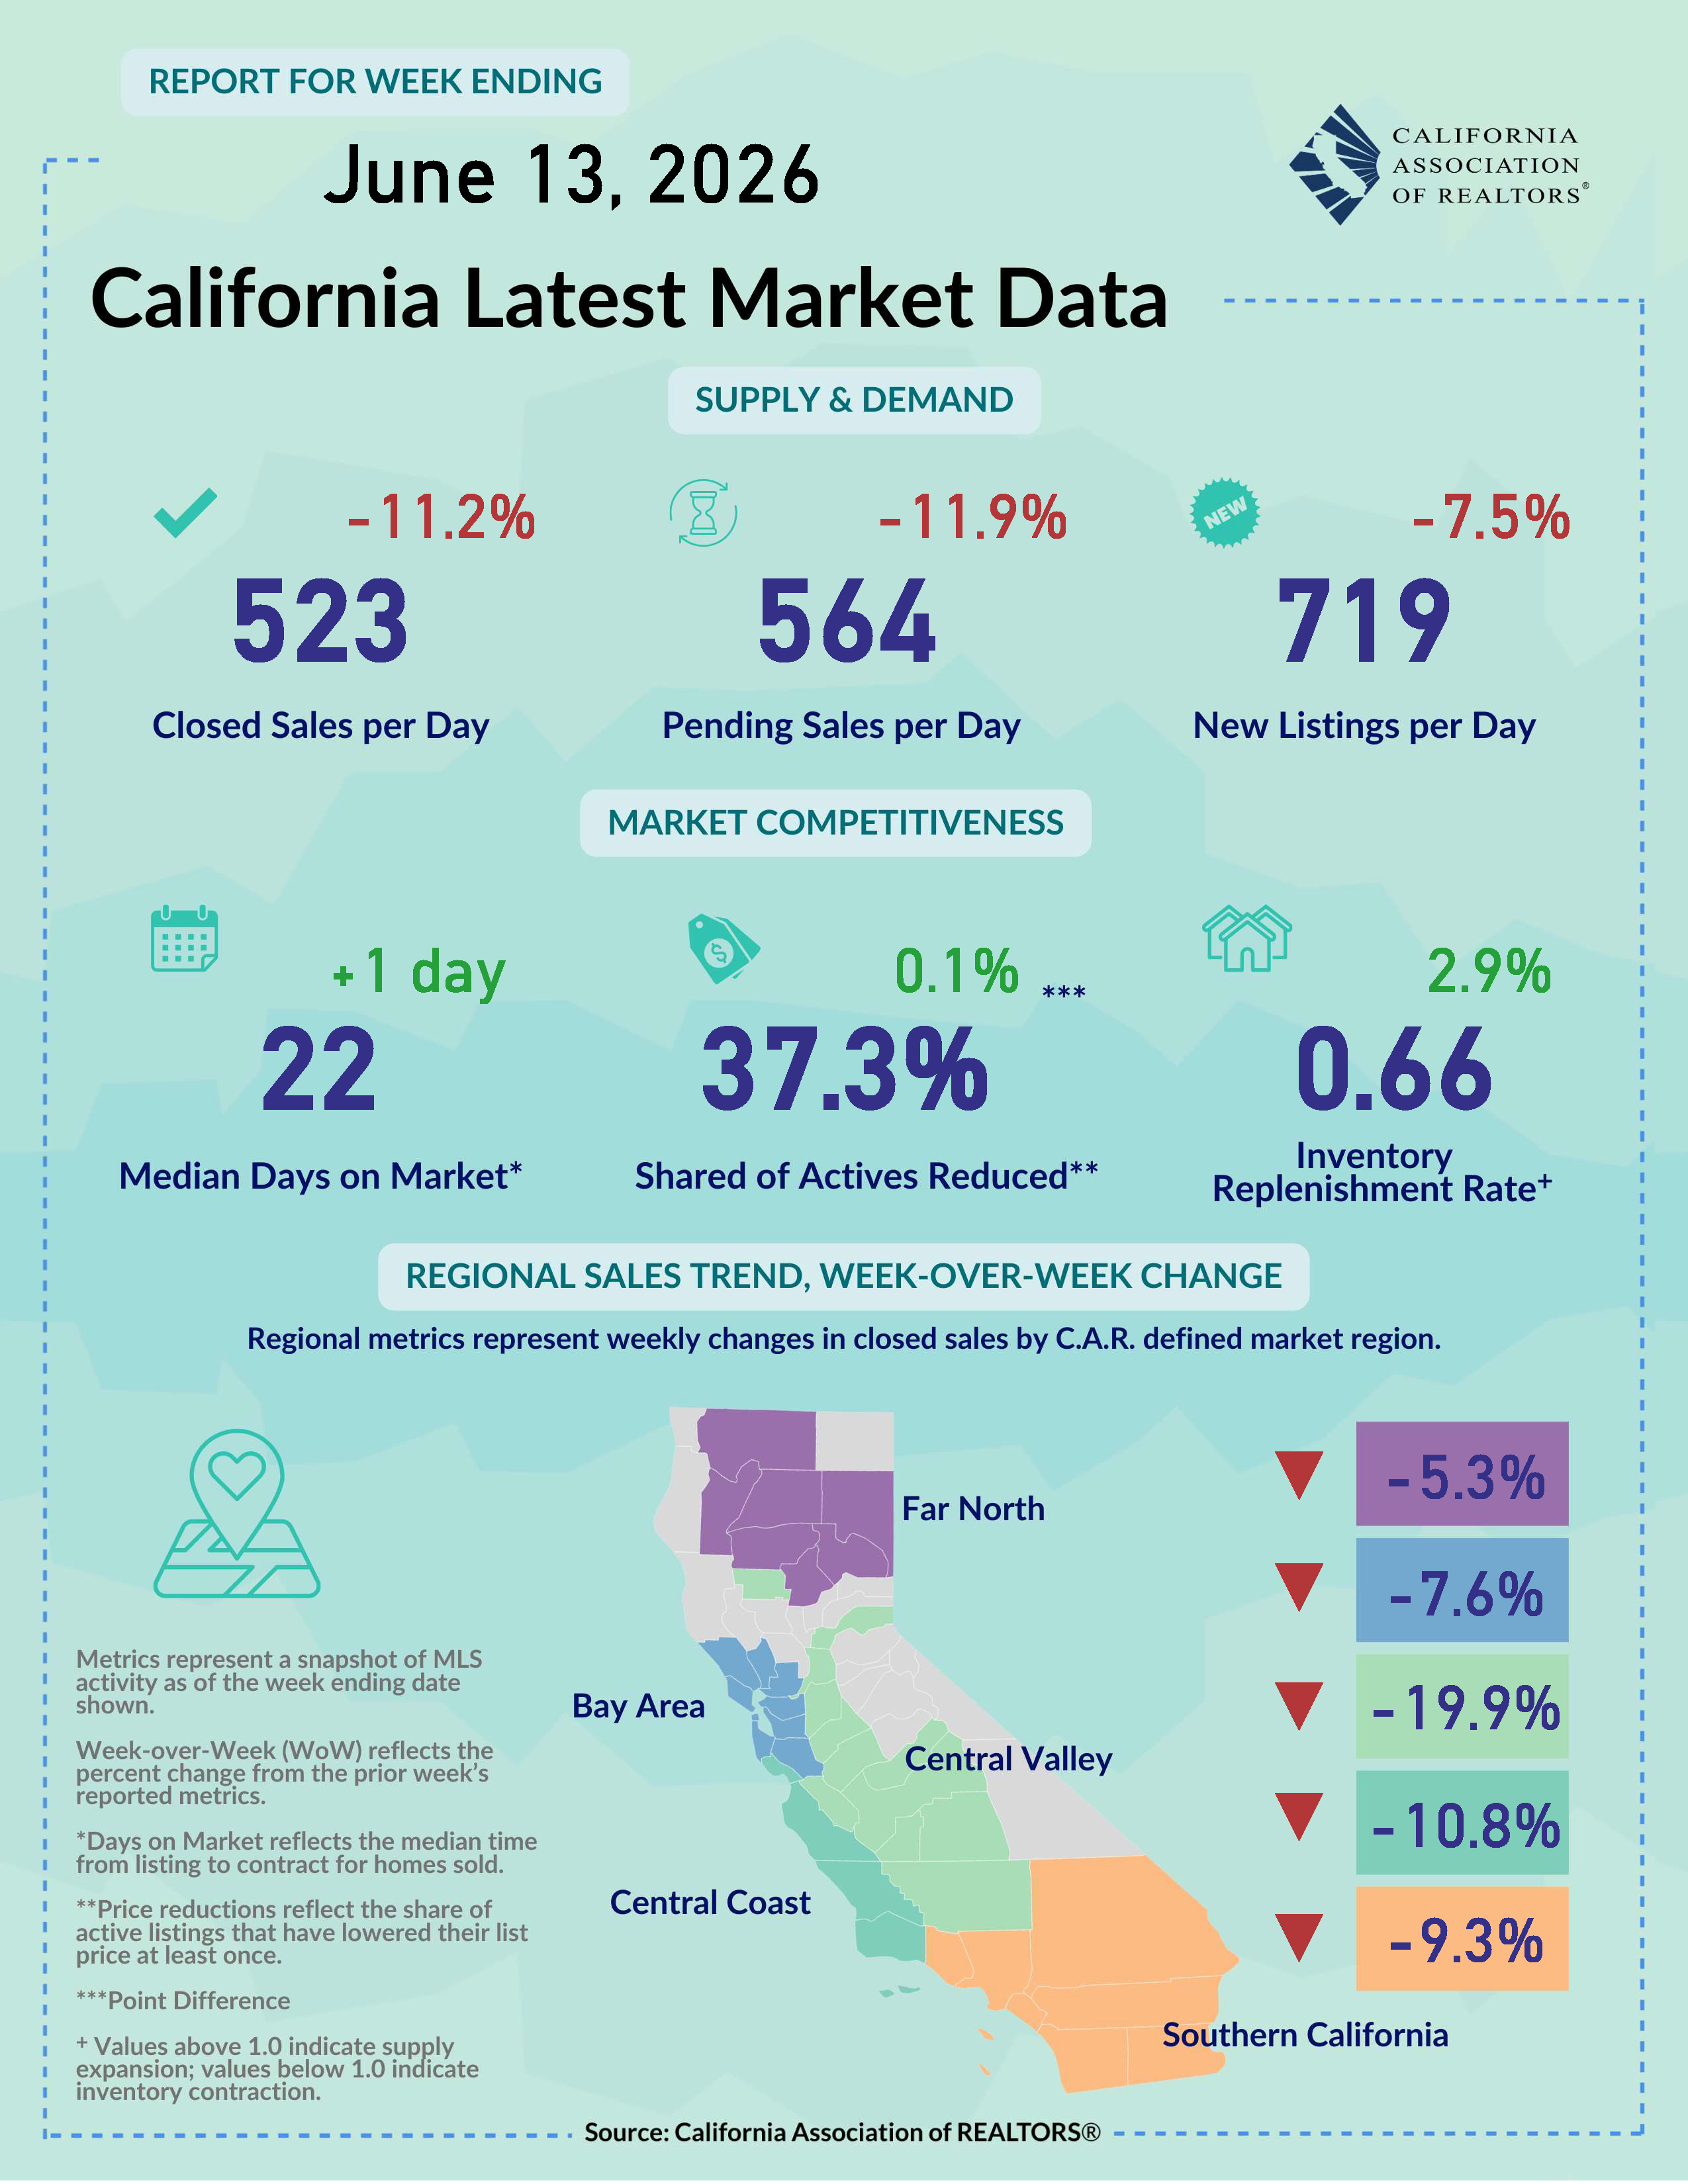
View the latest sales and price numbers. Find out where sales will be in upcoming months.
Get a roundup of weekly economic and market news that matters to real estate and your business.
Gain insights through interactive dashboards and downloadable infographic reports.
All Shareable Reports All Interactive DashboardsCatch up with the latest outreaches and webinars by the Research and Economics team.
C.A.R. conducts survey research with members and consumers on a regular basis to get a better understanding of the housing market and the real estate industry.
California Model MLS Rules, Issues Briefing Papers, and other articles and materials related to MLS policy.
Looking for information on how to file an interboard arbitration complaint? You've come to the right place! Find the rules, timeline and filing documents here.
Summaries and photos of California REALTORS® who violated the Code of Ethics and were disciplined with a fine, letter of reprimand, suspension, or expulsion.
The most recent edition of the Code of Ethics and Standards of Practice of the National Association of REALTORS® along with other important links to NAR information.
The California Professional Standards Reference Manual, Local Association Forms, NAR materials and other materials related to Code of Ethics enforcement and arbitration.
C.A.R. advocates for REALTOR® issues in Washington D.C., Sacramento and in city and county governments throughout California.
CREPAC, LCRC, IMPAC, ALF and the RAF comprise C.A.R.'s political fundraising arm.
The RAA: Protecting REALTORS® and Homeownership REALTOR® Action FundC.A.R. Senior Vice President Sanjay Wagle sits down with former Senate Majority Leader Emeritus Robert Hertzberg to discuss the proposed Middle-Class Homeownership and Family Home Construction Act.
Learn how you can make a difference, by getting involved yourself or by passing along valuable information to your clients.

|
June 15, 2026 – The end of the U.S.-Iran war is encouraging news for the economic and housing outlook, particularly as energy-driven inflation and business uncertainty have weighed on recent data. Easing geopolitical tensions should help reduce upward price pressures, improve small business confidence, and support a modestly better outlook ahead. Still, risks remain. Inflation is elevated, the Fed is unlikely to cut rates soon, affordability remains strained, regulatory costs continue to pressure new home prices, and rising equity withdrawals and foreclosure filings warrant monitoring. Overall, conditions have improved, but the recovery remains cautious and uneven. Headline inflation highest in three years but underlying pressures less intense: Consumer prices rose sharply again in May and recorded the highest annual increase since April 2023. The headline Consumer Price Index (CPI) soared 0.5% from the prior month and rose 4.2% from the same month last year. It was the first time in three years that inflation climbed above 4%. The spike was largely due to energy prices, which jumped 23.5% year-over-year and accounted for more than 60% of the overall monthly gain. Excluding more volatile energy and food prices, core inflation accelerated at a more moderate monthly pace of 0.2% and an annual rate of 2.9%. With the U.S. and Iran ready to sign an agreement to end the war, price growth could moderate in a few months after the delayed broader inflation passthrough is smoothened out. The Federal Reserve is expected to keep its fed funds rate unchanged in the upcoming meeting though and odds of seeing a rate cut this year remain slim. Small business optimism reaches lowest level since late 2024: Businesses started feeling pessimistic again last month after optimism stabilized in the prior month. The NFIB Small Business Optimism Index dipped 0.6 points (pts) to 95.3 in May from April, hitting the lowest level since October 2024 as the Middle East conflict remained unresolved. Uncertainty continued to hinder growth and put a halt on capital investment as the Uncertainty Index climbed 3 pts to 91 and remained well above the historical average of 68. The net percent of business owners expecting better business conditions fell for the fifth consecutive month to a net 3%, reaching the lowest level since October 2024. Seven of ten (70%) of them reported that supply chain disruptions affected their businesses to some extent, which could be a factor that resulted in 18% citing inflation as their single most important business problem in May – the highest level reached since December 2024. With profit margins continuing to be squeezed by higher costs, business owners had no choice but to hike prices. Both actual and planned price increases rose sharply in May, with the net percent of owners raising average selling prices jumping to 36% - the highest reading since March 2023. Those who planned to increase prices also surged, with the net percent climbing to 34%, the highest level since July 2022. With the U.S. and Iran reaching an agreement to end the war and open the Strait of Hormuz, upward pressure on inflation will begin to ease, and business conditions should improve in the upcoming quarter. Equity withdrawals hit 5-year high as lock-in effect continues to define the housing market: Homeowners withdrew equity at the highest first-quarter level since 2021, according to the latest ICE Mortgage Monitor report released by Intercontinental Exchange, Inc. (ICE). Equity withdrawals in Q1 2026 increased 2% to $47billion from last year, reaching the highest first-quarter level since 2021. While the latest quarterly figure was a 5-year high, the pace of growth in equity withdrawals has been decelerating as the 2% increase was the slowest growth rate in eight quarters. More than half (54%) of the equity withdrawals in Q1 2026 were in the form of second liens as 248k borrowers extracted $25 billion through this channel. With millions of homeowners sitting on first mortgages with rates well below prevailing market levels, second liens posted their strongest performance in 18 years as they have become an attractive option to access home equity. In fact, nearly two-thirds of second-lien originations in Q1 came from 2020-2022 borrowers, and 3.9 million homeowners who took out a first mortgage during that period have added second liens. While home prices remain elevated and are not projected to pull back sharply in the near term, the record surge in second liens and home equity lines of credit in early 2026 presents a distinct risk for more defaults in the housing market, as overall monthly debt burdens could increase significantly for homeowners with second liens. Building regulatory costs jump sharply from 2021: New home building costs incurred from government regulations surged significantly in the past five years, according to a recent study released by the National Association of Home Builders. Results from the study indicate that the average cost of regulation on a typical new single-family home in the U.S. has climbed more than 40% to $131,734 in 2026 from $93,871 in 2021. Over one-third of the cost ($46,795) is attributable to regulations imposed on a higher-priced lot during its development and the other two-thirds ($84,939) is from regulatory costs imposed on the builder during construction. With the average price of a new single-family home at $499,500, the estimated regulation cost accounts for 26.4% of the final price of a newly built home for sale – an increase of nearly three percentage points from the number reported five years ago. Combined with other cost increases including those on building materials, finished lots, and skilled labor, hikes in regulatory costs continue to put upward pressure on new home prices and could limit new housing supply further if the trend continues. Foreclosure moderates from early 2026 but increases again from last year: U.S. foreclosure filings decreased on a month-over-month basis but jumped again by double-digits from 12 months ago in May, as rising homeownership costs continue to put pressure on homeowners. According to ATTOM, there were a total of 40,355 U.S. properties with foreclosure filings last month, a decline of 5% from April but a surge of 14% from May 2025. At the national level, one in every 3,562 housing units had a foreclosure filing last month, while California had one foreclosure in every 3,541 homes. The Golden State had the 18th highest foreclosure rates among all states in May, while Florida (1 in 2,110) topped the chart last month and Vermont (1 in 22,603) came in last. Lake, Butte, Sutter, and Kern were the counties in California that had the highest foreclosure rate in May. Despite the sharp increase in filings in the U.S. from last year, strong homeowner equity and disciplined lending practices continue to put a cap on default activity. With foreclosure volumes staying well below the historical norm, housing fundamentals remain sound amid a market with soft demand. Note: This summary report gets updated every Monday by 6:00 pm PST. Feel free to email us at [email protected] if you have any questions and/or feedback.
|
|